

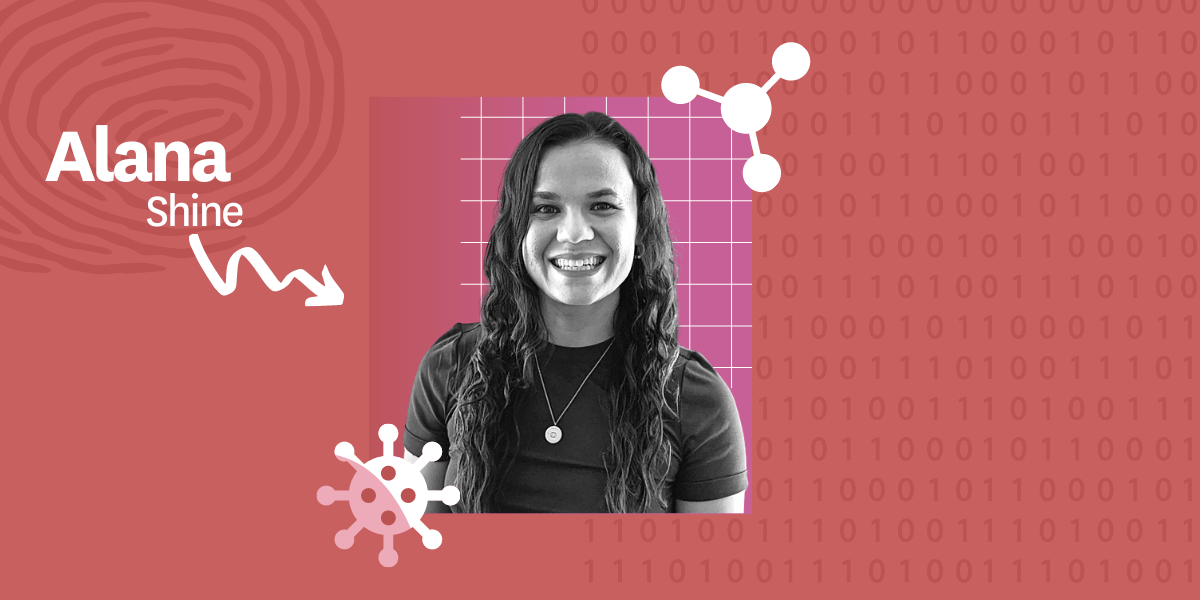
Alana Shines designs graphs, which can be used as a way of mathematically representing the complicated, interconnected world we live in. Photo/Alana Shine. Design/Izzy Lux.
Let’s say you want to understand how the coronavirus might spread between people in a community. How would you figure that out? If you’re a computer scientist, you might use the mathematical notion of a network—or more properly, a graph.
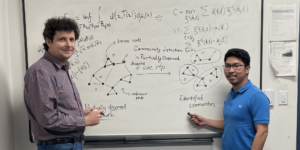
A graph is a structure of nodes and connections between nodes, called edges, showing relationships between objects. It can be used as a way of mathematically representing the complicated, interconnected world we live in. At USC’s Department of Computer Science, new PhD graduate Alana Shine has spent her time as a master’s and doctoral student researching graphs, advised by Professor David Kempe, as part of the USC CS Theory and Algorithms Group.
Predicting disease spread
Graphs can be used to model many things, but they are very helpful in modeling social networks. As such, graph theory can help predict when and where disease might spread to optimize quarantine regions and reduce infections.
“I design ways to generate graphs that model human interactions, so that people can run simulations to see how, for instance, information or disease spreads,” said Shine.
“When people want to test immunization of certain people on the graph to see if it works, they need a lot of data to test it out on and those are the models I make.”
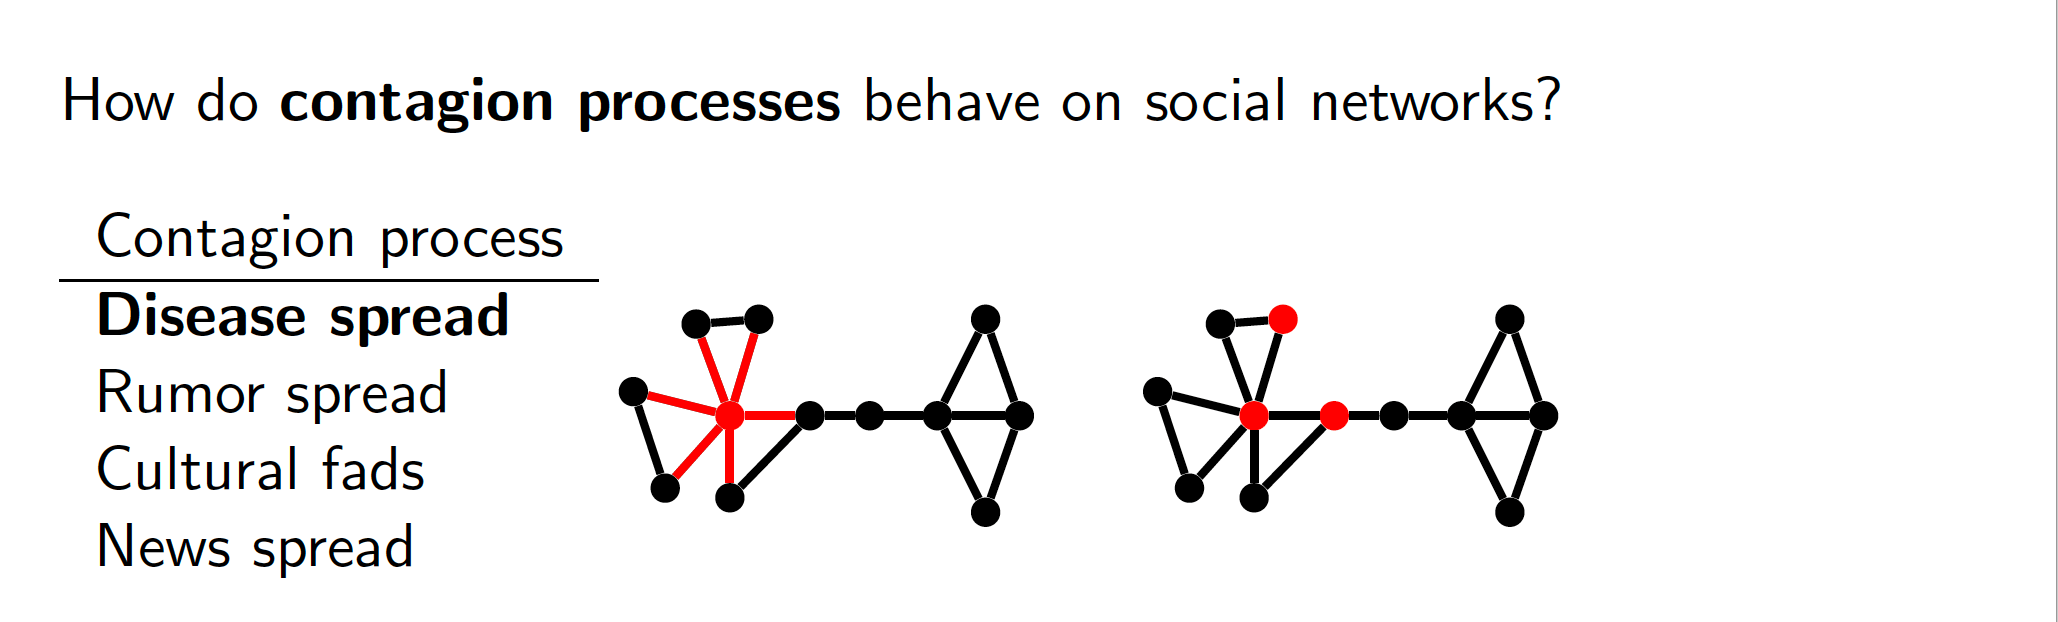
Graphs can help researchers model contagion process, ranging from disease spread to rumor spread on social media. Image/Alana Shine.
Specifically, Shine designs “generative graph models” for real-world graphs, which allow simulations to run on large numbers of graphs with real-world properties.
Generative graph models take a real-world graph example and use it to generate new graphs, which can be used to populate a graph dataset. This is important, because running simulations on just one real-world social graph can fail to provide enough information to generate realistic results.
Modeling human interactions
Shine analyzes “global connectivity measures,” because processes like disease spread, information flow or rumor spread depend on global structure. In other words, for these simulations to give insights into real-world events, generated graphs must capture the global connectivity properties of real-world graphs.
When designing a generative graph model, she takes a real-world graph example— such as a city’s social graph—extracts some measure of its global connectivity, and then generates a large number of graphs that share this real-world global connectivity structure.
“There are many projections about the pandemic’s reach and numbers depending on different types of behaviors, but modeling that behavior accurately is dependent on the underlying graph,” said Shine.
“You need to know not only how many people are interacting, but who those people are interacting with and where. All of that is important in whatever simulation you’re running.”
Beyond expanders
There are known problems with traditional graphs that Shine wanted to address in her research. First, most graphs are a highly-connected type called expanders.
Diseases spread quickly on expander models, because they’re highly connected, which can lead to inaccurate modeling outcomes, resulting from the assumption that all real-world graphs are expanders.
“A large class of generative graph models match local properties, like number of friends, and randomize everything else which, with high-likelihood, produces an expander,” said Shine.
To address this, Shine “zooms out” and looks at connectivity patterns on a much larger, global scale, which requires more complicated math to describe.
“These graphs, which are subject to more complicated connectivity patterns, is a relatively new area of research,” said Shine. “What we’re doing with global connectivity is much harder to describe in a compact way.”
Her goal is to capture the most important parts of global structure and randomize everything else, so the simulations are realistic. One example of connectivity where Shine and Kempe’s models outperformed previous models that focused on more local features: matching the degrees of separation between people.
“My generative graph models improve upon matching longer degrees of separation than short,” said Shine. “To match short degrees of separation, the expander graphs work well because the graph is highly connected.”
Shine, who grew up in Claremont, CA and attended Pomona College for her undergraduate degree, has secured a job at Facebook in New York City this fall, where she also completed two internships during her time at USC. She hopes her work will help other research groups, who might not have access to massive amounts of real data, to simulate possible outcomes to real-world events with more accuracy.
Published on October 12th, 2020
Last updated on April 8th, 2021