
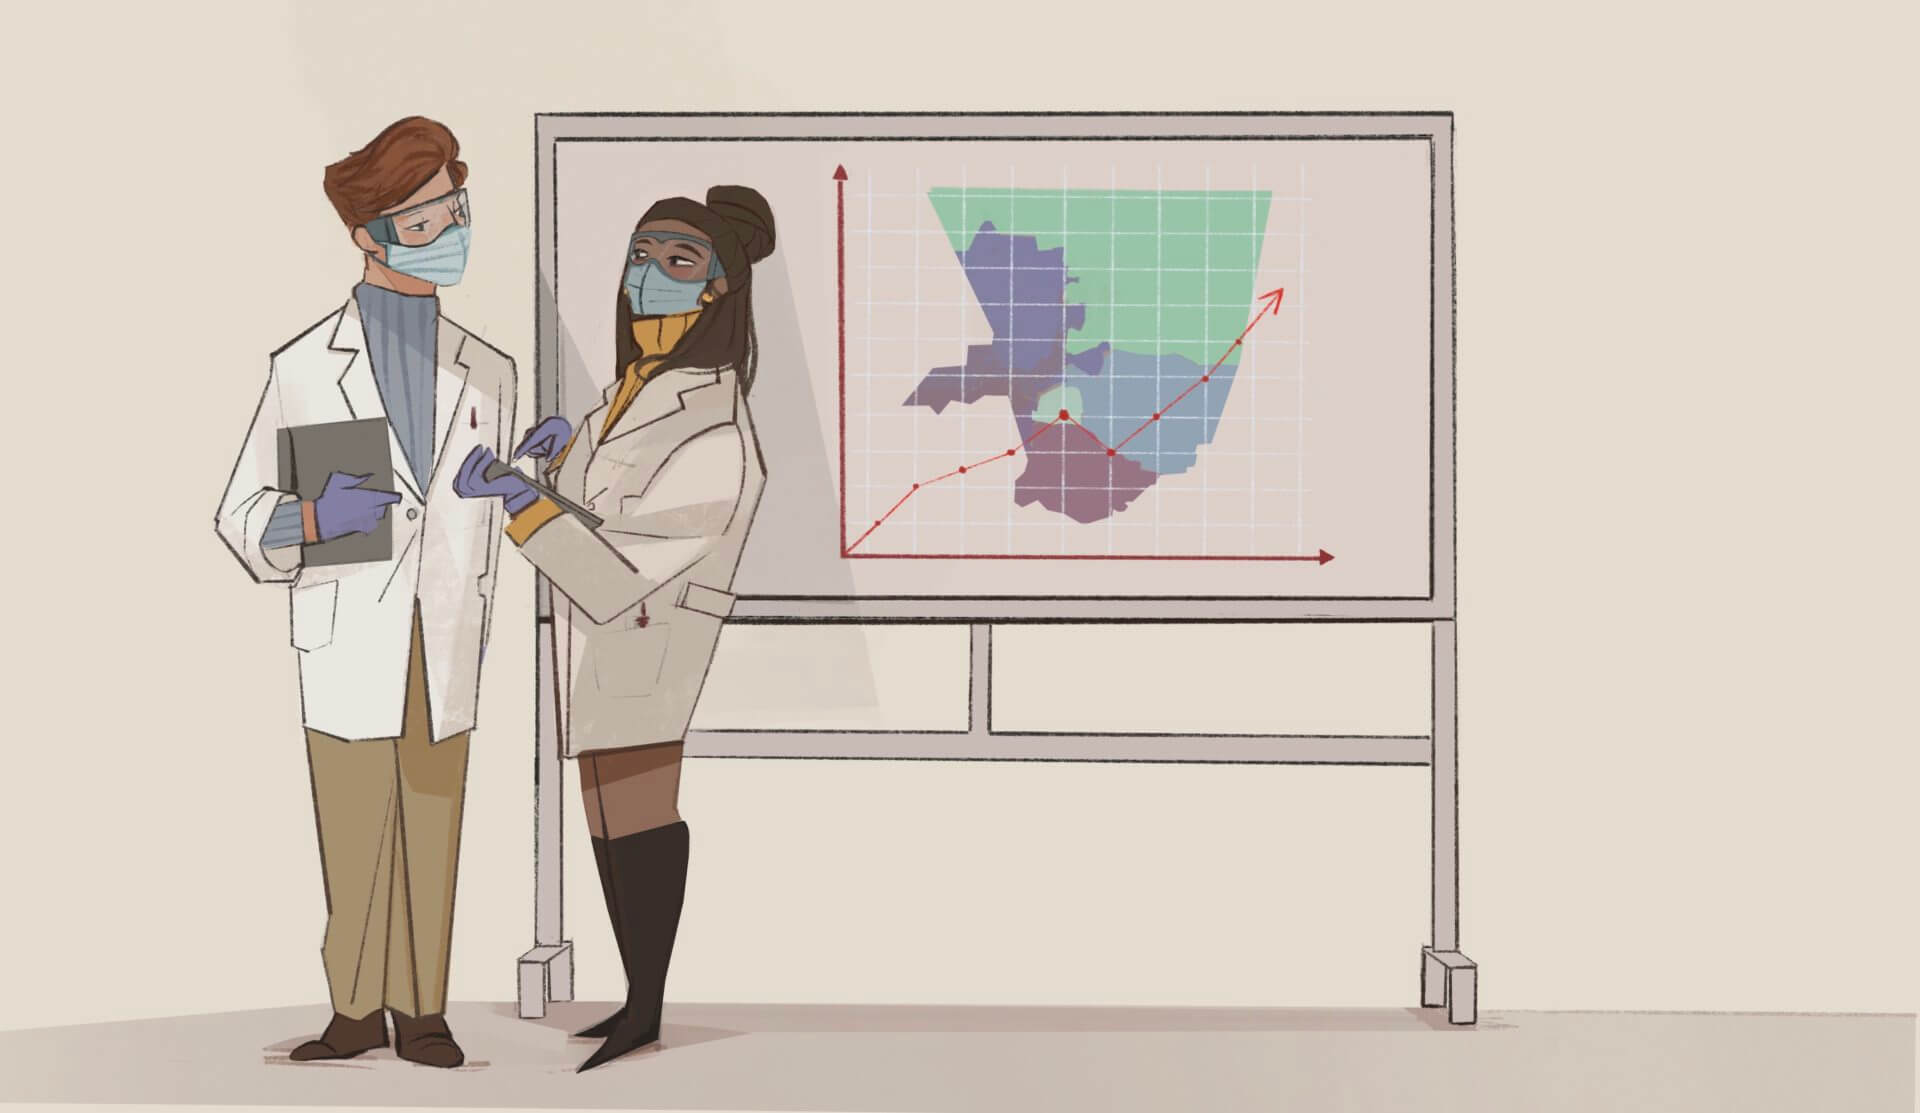
(ART/SHUTIANYI LI)
This Fall, following the National Academy of Engineering (NAE) Call to Action for engineers to “crowdsource and collectively brainstorm engineering solutions for the coronavirus disease (COVID-19),” USC Viterbi is offering “Viterbi vs. Pandemics!,” a new lecture series by USC Viterbi faculty to comprehensively provide an engineering-centric framework for addressing and understanding the COVID-19 pandemic.
During the 10-week, free program, students gain exposure to myriad topics, ranging from the estimation of risk and protein engineering by directed evolution to the contributions made by computer science and electrical engineering faculty in automating human safety technologies, detecting misinformation and digital contact tracing. The one- to two-hour sessions take place on Thursdays at 6 p.m.
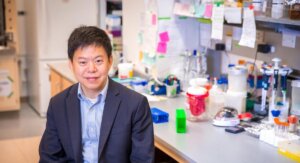
On October 9th, Bhaskar Krishnamachari, Ming Hsieh Faculty Fellow, professor in electrical and computer engineering and director of the USC Viterbi Center for Cyber-Physical Systems and the Internet of Things, presented his lecture: “Estimation of Risk.” Krishnamachari discussed how to define the risk of infection from an epidemic and how to estimate and visualize the risk over time for different communities.
For those who missed it, can you briefly summarize your lecture for a general audience?
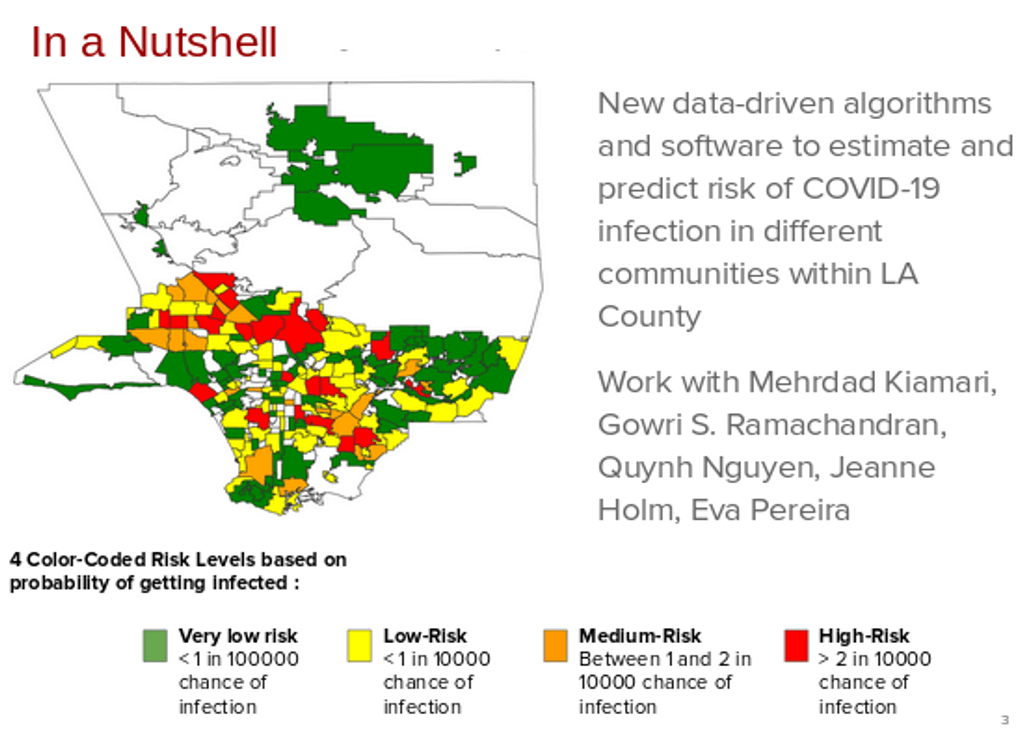
It provides an introduction to a new COVID-19 risk score that we developed at USC Viterbi. The score — which is computed daily for each community based on the latest case data — indicates to an individual the likelihood that they could get infected within the next 24 hours within their community. It can also be presented as a color-coded map showing the level of risk in different communities. A live version of our risk score and a color-coded map based on it for L.A. County can be found here.
Why is this research important? How will it help in the fight against COVID?
We believe this risk score is more intuitive and can help communities understand risk better. Our risk score might be easier for people to understand than general statistics on case data or parameters like Rt (the time-varying reproduction number that is used by some sources to communicate risk). We show that our metric paints a more accurate picture of infection risk compared to these other measures.
How would you compare your research to similar research or ideas, either in academia or industry?
We are not aware of any risk-scoring metric proposed by any other academic or industry team that helps individuals determine their probability of infection on a per-community level. The innovative nature of this contribution is one-reason the work received 1st Prize at the LA COVID-19 Computational Challenge organized by the City of LA and GRMDS earlier this year.
We did this in part by building on the classic SIR epidemic model, which is well-known in academia. But we focused on a specific time-varying version of that model and taken steps to make sure the data we pull from it is especially clear and focused to the average person.
What are the next steps and/or milestones in terms of your work?
We are working on submitting the work for peer review and have some ideas to improve our code and modeling. We would love to see other cities, counties and countries adopt the model to help communicate risk to their citizens.
Tell us about your collaborators. What unique skills does each person bring? Are you partnering with any doctors, clinicians or other non-engineers in this work?
Our team includes Ph.D. student Mehrdad Kiamari who did a lot of the mathematical modeling and coding for this project, as well as senior research associate Dr. Gowri Ramachandran and a postdoctoral research staff member, Dr. Quynh Nguyn, who contributed significant ideas, code and effort to maintain our data repositories. We have also worked with officials from the City of L.A.’s data team, Chief Data Officer Jeanne Holm and Deputy Chief Data Officer Eva Pereira, to get relevant data from L.A. for our modeling and development efforts.
Can you share one story from your pandemic life? How has it impacted your work and family? What are you doing to stay sane?
It’s been a challenging time, but I have also appreciated the opportunity to prioritize what is important and meaningful. Working on projects like this one that are timely and helpful to others – and more rewarding than ever before. Of course, research is often such a collaborative effort; I miss spending time with people on our beautiful campus, and interacting with students in the lab or classroom. I practice meditation daily, and I credit it with keeping me sane and productive.
From a research perspective, what do you consider the most surprising or counter intuitive aspect of the virus or the pandemic as a whole?
The high variance or dispersion of the spreading process really intrigues me. It surprises a lot of people to hear that most people that get the virus do not pass it on. In fact, a relatively small fraction of those that have it are responsible for most of the infections. We still don’t have a very good handle on how to model and manage such a process.
What are some words of wisdom regarding the pandemic that have meant a lot to you?
It’s not specifically about the pandemic, but this is a quote from “The Once and Future King” by T.H. White that I used as a preface to my lecture. Not only does it fit the current climate well, it also shows us how we can still do meaningful in times like this:
“The best thing for being sad,” replied Merlin, beginning to puff and blow, “is to learn something. That’s the only thing that never fails. You may grow old and trembling in your anatomies, you may lie awake at night listening to the disorder of your veins, you may miss your only love, you may see the world about you devastated by evil lunatics, or know your honour trampled in the sewers of baser minds. There is only one thing for it then — to learn. Learn why the world wags and what wags it. That is the only thing which the mind can never exhaust, never alienate, never be tortured by, never fear or distrust, and never dream of regretting. Learning is the only thing for you. Look what a lot of things there are to learn.”
If you could only share one slide from your talk, what would it be and why?
This slide summarizes the talk and shows our color-coded map for risk in L.A. County (as it stands this week).
Related Paper: COVID-19 Risk Estimation using a Time-varying SIR-model
Published on October 19th, 2020
Last updated on April 8th, 2021