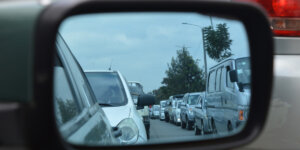


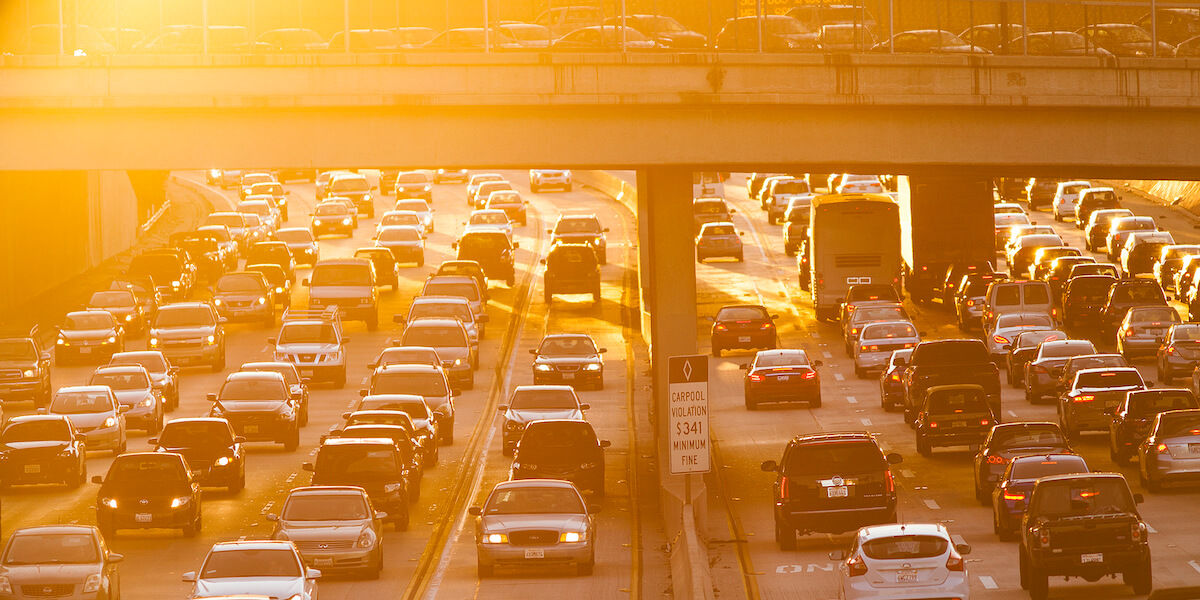
A new project will examine how the movement of traffic may offer insight into the spread of COVID. Image/Wikimedia Commons
Your car is at a standstill on LA’s notoriously busy 110 freeway. The last thing on your mind is how this bumper-to-bumper snarl could be a vital clue in the fight against the spread of viruses like COVID. However, this is exactly what a team in USC Viterbi’s Daniel J. Epstein Department of Industrial and Systems Engineering is hoping to discover.
As our world learns to live with and manage endemic COVID and the emergence of new variants like Omicron, Assistant Professor Sze-chuan Suen, together with Epstein Department Chair Maged Dessouky and Professor Neeraj Sood from Price School of Public Policy, will work on a new National Institute of Health-funded project, which will harness traffic data to see what it can demonstrate about how the virus is spreading in Los Angeles.
It will be the first time that traffic data has been leveraged at such a large scale to inform disease control methods.
Collaborating with the Archived Data Management System (ADMS) project team at USC, Suen will use traffic pattern data collected from road sensors throughout LA County to see how the population flows through the city on a day-to-day basis. This information will inform a mathematical model of COVID-19 spread, which can then be used to identify which health districts in the county are at highest risk for unidentified cases. The researchers will use this modeling in partnership with the LA County Department of Public Health to better locate testing sites within these at-risk regions.
“There’s this big mystery around transmission patterns, and you need to do that modeling really accurately if you want accurately forecast for COVID. One of the ways you might be able to do this is by looking at population flow over different regions of LA,” Suen said. “There’s so little easily accessible information on how people are flowing between different regions of the county. This will give us some indication of which areas are more connected than others.”
You would expect that in a sprawling megacity like LA, a fair proportion of the daily traffic flow would be from those in residential areas driving along the freeways to and from work in centers such as Downtown.
“So if there is a large connection between those two areas, and you might imagine that if you see a spike in cases in that residential area, you may also see a spike in areas such as Downtown,” Suen said. “But also in the areas that are downstream of that—for example if people go downtown and then go back to another residential area, you may see a spike in cases in that other residential area because people are contracting it at work and then bringing it back home.”
Early in the pandemic, when much of the county was under stay-at-home orders, we were greeted with surreal images of blissfully empty freeways. Suen said that such lockdowns may also have an impact on both traffic flow and disease spread. One of the initial goals of the project was to try to ascertain through traffic data and observing traffic movement whether lockdowns were working and residents were sticking to stay at home orders, or if they were ignoring advice and going out to beaches and parks.
Suen said that her project team would be making use of information that ADMS has from sensors on both local roads and freeways, which can track how many vehicles are passing over the sensor and how fast they’re traveling.
“But they don’t capture things like where this vehicle is coming from and where they’re going to, so we have to infer those origin destinations from the data itself. So we’re running an optimization algorithm to help us infer where the traffic came from and where it’s going at different times of day,” Suen said.
“We’re hoping to get patterns and to do projections of cases and hospitalizations for COVID in LA across different geographical regions, which can potentially help inform things like where we should set up vaccination sites and testing sites,” Suen said. “Are there high priority regions where we’re expecting a spike in cases that we may want to divert more resources to because we expect more hospitalizations there?”
She said that previous work in this area of transport data modeling has used cell phone information, subway traffic volume or flight information, yet this would be the first time that traffic sensor data is applied to disease modeling.
“We hope that the type of work that we end up doing in the patterns that we see for COVID would be applicable to things like flu or other types of respiratory diseases, so it’s not just a one-shot. We’re really hoping to move the science here,” she said.
Published on January 18th, 2022
Last updated on January 18th, 2022