

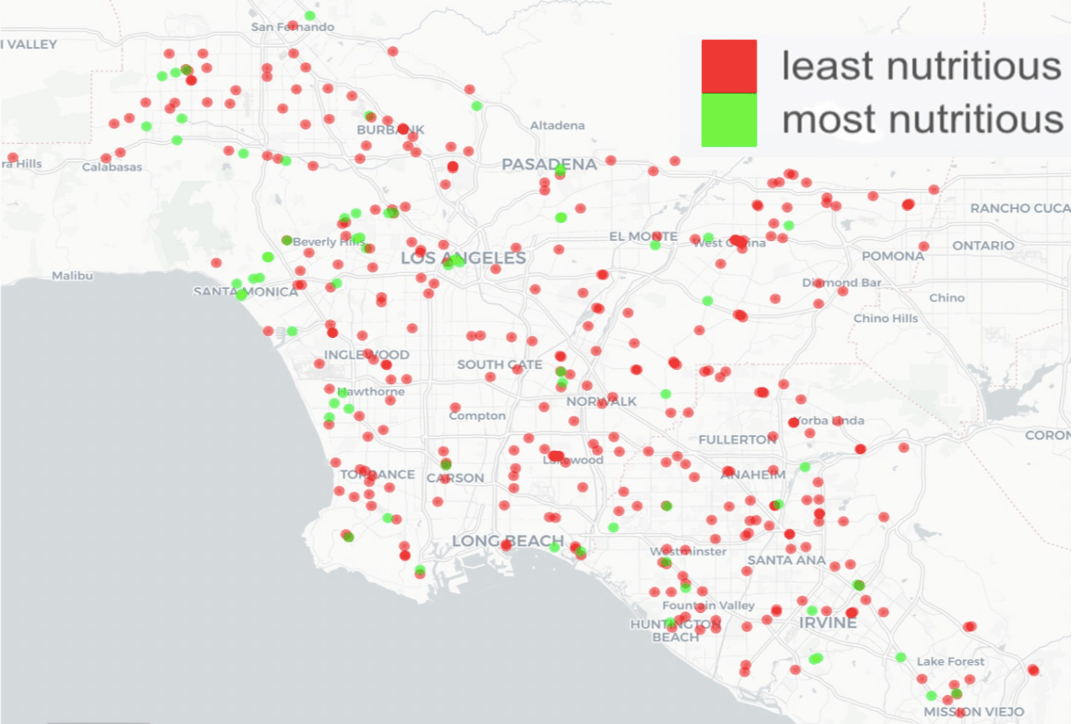
A map of the LA food environment shows more nutritious options clustered in more affluent areas. Image/Abigail Horn
It’s midweek, and the fridge is bare. How do you stave off the gnawing hunger? Perhaps you turn straight to your favorite local takeout or a trusty delivery app to get that food fix.
For one researcher at USC Viterbi School of Engineering, delivery apps and online menus are an even more valuable resource. The digital menu information offered by online ordering sites represents a big-data goldmine that can give us a detailed map of the nutrition of Angelenos—where disparities in food access exist and how we can address them.
Abigail Horn, research assistant professor in the Daniel J. Epstein Department of Industrial and Systems Engineering and the USC Information Sciences Institute, studies how data can increase our understanding of eating behavior, diet and health. Her latest work aims to build a map of the nutritional quality of the urban foodscape in Los Angeles, using machine learning to analyze information on digital menus for all restaurants, from top-100 chains to small mom-and-pop operations.
The results will help inform public health research, which generally relies on overly simplistic measures of food environment nutritional quality. The work will ultimately inform decisions with the potential to improve zoning policies to increase access to healthy, nutritional options in disadvantaged communities.
The NIH National Institute of Minority Health recently awarded the project the Top Poster award at the inaugural workshop of the Health Equity in Action Annual Workshop.
The research is centered on identifying where healthy and unhealthy food outlets are located. The work has a particular focus on where unhealthy outlets are clustered in the city, and where there is low access to healthy food. These areas are often known as food swamps — neighborhoods with a high concentration of low-quality fast-food outlets, liquor stores and convenience stores and a lower concentration of fresh food outlets and grocery stores.
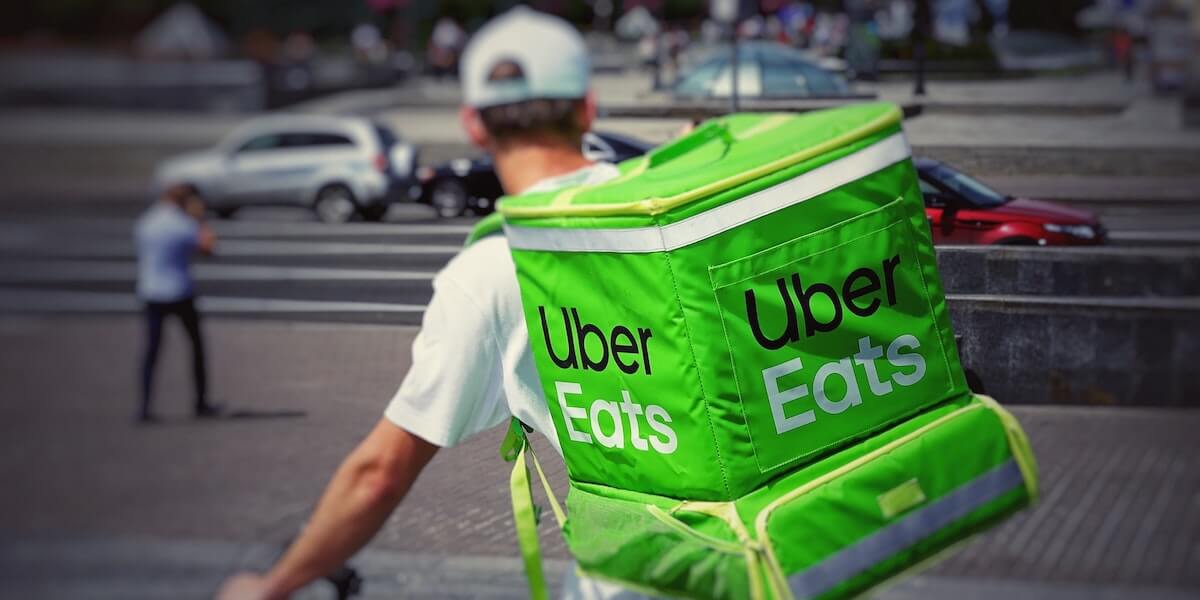
A cyclist delivers for Uber Eats. Image/Robert Anasch.
Existing public health research frequently characterizes food environment nutritional quality by focusing on the number of food outlets in a neighborhood within each business listing category, for example, using the North American Industry Classification System (NAICS) categorization of food outlets which differentiates “limited service” from “full service” restaurants and “grocery.” outlets. “Limited service” restaurants are often used as a proxy for fast-food outlets, which are in turn considered an indicator of poor nutritional options. It does not consider a newer generation of limited service restaurants that offer menu alternatives such as salads, grain bowls, and wraps—think Sweetgreen, Veggie Grill or Chipotle. Harnessing this classification system, a neighborhood’s proximity to a grocery store would be the only positive indicator of nutritional outcomes.
Horn said that these types of categorizations make it difficult to gain an accurate overview of the nutrition of the city and which residents faced disparities in access to healthy food.
“If it’s fast food, it’s unhealthy,” Horn said, “or if it’s a grocery store, it’s healthy, because there is some fresh food there. We’re really missing the diversity of nutritional quality within these categories and across categories. There is so much digital menu data available, and so the idea of the project was to use that data to create a more refined indicator of the nutritional quality of the food on offer.”
The key hurdle the project faced was that restaurants are not required to publish their nutrient information, aside from chain brands with 20 or more outlets. For non-chains, the available information is limited to how these businesses describe individual dishes on their menus.
In work together with Computer Scientist at the USC Information Sciences Institute Keith Burghardt, Andrés Abeliuk from the University of Chile and USC Viterbi Master of Science in Applied Data Science student Alex Seo, Horn developed a model that estimated the nutritional value of menu items across a broad cross-section of restaurants. The team has partnered with Edamam, a food database and provider of nutrition data and analytics, which is sharing data to power the model.
“That’s where the machine learning comes in. Edamam has created an impressive database of what we call generic food items, which they developed through their own proprietary analysis of over 50 million recipes online. So we use that to train a neural network to predict the nutrient distribution of a food item,” Horn said.
The neural network was also refined with the help of a fastText language embedding model, a simple pre-trained text-based model. Horn said when the model is used together with data from the recipe databases, this gives additional context to food words on menus and how the terms are used together, thereby improving the predictions.
Horn also used data from another company, Nutritionix, to gather detailed nutrition and ingredient content data from large chain restaurant menus.

Abigail Horn – Research Assistant Professor in the Daniel J. Epstein Department of Industrial and Systems Engineering and the USC Information Sciences Institute
“We are also accessing data from websites like Yelp,” Horn said. “In addition, Edamam, the nutrition data company that shared the generic meal data with us, had previously done some scraping of restaurant menus from across the country. Next we will be applying the algorithm to restaurants in this database and use it to investigate disparities in the urban foodscape in LA.”
The project is funded by the Southern California Center for Latino Health, and Horn said a key focus is to better understand and capture the types of restaurants and food options available in areas with predominantly Latino residents.
Initial findings examined around 1000 restaurants in the region, all within the “limited service” NAICS category and found a wide distribution in the nutritional quality of the menus.
“Within that one category of limited service restaurants, we see a huge diversity of nutritional scores. When we plot those on the map you see there are some pretty clear geographical patterns in where the healthier outlets within that category are located,” Horn said. “What we see is that the unhealthiest outlets are almost uniformly distributed across the map. They are everywhere. The healthiest outlets are clustered only in the more affluent neighborhoods.”
“It may seem like there’s a food swamp in Venice because there are still a lot of unhealthy outlets but when you examine it, there are also a lot of salad joints there. That’s something we don’t see in East or South LA,” she said.
As the project expands, Horn said that she hoped it could be a tool for public health researchers to paint a more accurate nutritional picture of the city.
“It would be wonderful if it could help inform policy around rezoning in neighborhoods,” Horn said, “and help to create quantified metrics of where we have disparities and the true nutritional quality of food outlets.”
Horn said there are federal food financing initiatives that invest money into improving food environments and incentivizing new healthy outlet options and grocery stores.
“In those kinds of financing schemes, that could be a scenario where we can help identify neighborhoods that truly have extreme disparities, instead of relying on business listing categories to tell us what might be unhealthy and needs reforming,” she said.
Published on April 3rd, 2023
Last updated on April 11th, 2023