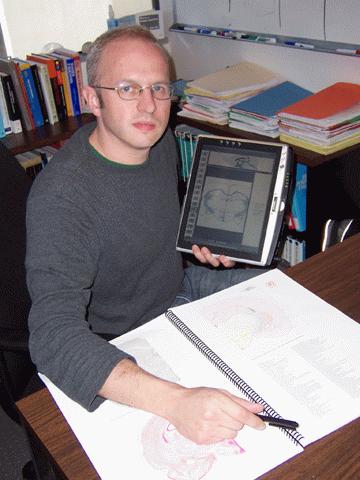
Gully A.P.C. Burns revived the NeuART effort to turn printed brain atlases like the one on the desk into flexible digital resources.
An ISI computer scientist led an effort to perfect a cheap, quick and copyright- respecting way to turn existing print brain atlases into multimedia resources. The software, now available in an experimental beta version for free download, is a robust and user-friendly interface that works on all the most popular computer operating systems.
“Brain atlases are basic tools for researchers in neural science,” says Gully A.P.C. Burns, a specialist in neuroinformatics who works as a research scientist at the University of Southern California’s Information Sciences Institute, part of the USC Viterbi School of Engineering. “Our NeuARt II system will make them much more user-friendly.The same viewing system, Burns believes, can help neuroscientists store, organize and use data from ongoing experiments.
Burns was part of a team of computer experts and neuroscientists that worked with Larry W. Swanson of the USC Neuroscience Institute, author of the standard printed rat brain atlas, Brain Maps, Structure of the Rat Brain, (Elsevier Academic Press, 1992-2004) to produce the NeuroARt II viewer, following up on years of earlier development. “The entire design of our approach arose from practical methods” from Swanson’s lab, according to a paper on the project Burns co-authored, published this month in the online journal BMC Bioinformatics.
The NeuART goal is making it easier to consult and compare intricate and extremely detailed data about a three-dimensional organ – a rat, mouse, or human brain – that is stacked up in hundreds or even thousands of cross sectional views.

NeuART II interface allows viewing of multiple pages at once, overlapping, and more. (click on image for expanded view)
Now researchers need to open a book to do this, which can slow things down.
“Researchers need to be able to find a given segment immediately, and compare the segment with any other,” says Burns. “To do this using a printed volume like Swanson’s involved continual back and forth page turning and index consulting. Page turning means that researchers can’t look at two or three or five images side by side or on top of each other.”

Work started on the original NeuARt project ten years ago as part of the USC Human Brain Project (lead by Michael Arbib who has appointments in computer science, biomedical engineering, and biological science). A team of computer scientists (Ali Dashti and Jim Stone) worked with Swanson and Thompson to create a preliminary prototype but funding ran out and the project died.
“I was involved in the later stages of that project and felt that it would be a shame just to let the idea die,” said Burns, who took the lead in reviving NeuART as a part of a larger development effort he was working in, concerned with knowledge management of the neuroscience literature.
Burns asked programmer Wei-Cheng Cheng to develop a prototype under the guidance of Swanson and Thompson guidance. Cheng wound up rebuilding NeuART from the ground up, said Burns.
The revised NeuARt II interface indexes the data in a variety of ways, including spatial maps and alphanumeric information, coming off a single interface. It includes all the information in the printed volumes, in a much more accessible form.
It does so without violating copyright, Burns said. Publishers of the atlases make available to purchasers of the volumes the plates included in the books on CDs, as Adobe Illustrator files.
The NeuART II software works from these CDs, checking copyright and also making sure that the user has a valid copy of Adobe illustrator, and then using a JavaScript program converting the files into a standard vector graphic (SVG) format. The SVG images are stored on the users system and organized using the software, which works on Linux, Windows and Macintosh operating system computers.
The CD images contain indexing information that the software utilizes to create displays that can combine any number of page images in an organized fashion. [See page diagrams].
A researcher working with her own set of images – typically taken from a set of brain sections – can, working back and forth from the software, integrate them with atlas pages, once the exact brain location of the section has been recognized. To do this, the research superimposes her research images on top of the appropriate atlas page and then saves the superimposition as a copy.

So far, the only users have been researchers in Swanson’s lab, says Burns, but he expects once scientists in the field learn about the work, the advantages will be obvious.
He hopes to build on the system to create a general visual interface for neural data, linking brain locations (specified by coordinates) to research results concerning those locations, – “a kind of Google Earth for brain data,” he calls it.
The viewer software is open source and free, and can be downloaded from http://www.neuroscholar.org/neuart_demo.html
“NeuART was an alpha version,” says Burns. “NeuARt II is beta. We are hoping to improve it with help from researchers who use it.”
Swanson holds the Milo, Don, and Lucille Appleman chair in the USC College of Letters, Arts and Sciences. Arbib holds the Fletcher Jones Chair in the Viterbi School of Engineering. The National Institutes of Health supported the research.
In addition to his NeuART II project, Burns is involved in a variety of projects to make information about brains and neural systems in general more accessible through his NeuroScholar project.
Published on December 11th, 2006
Last updated on June 6th, 2024


