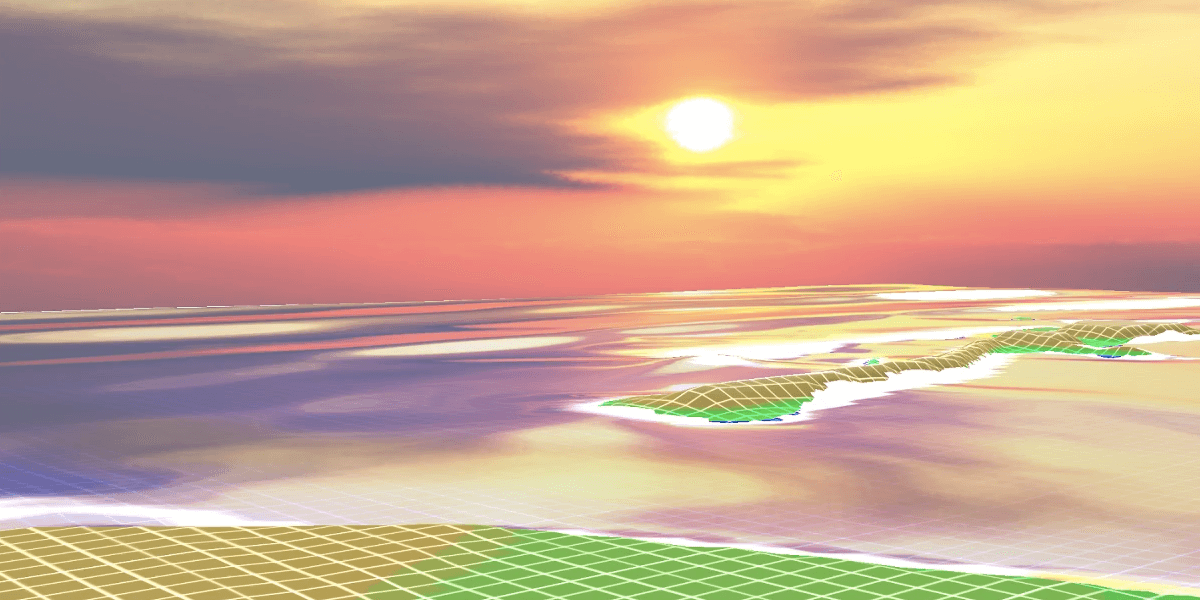
Waves breaking on Chania beach, Greece, simulated by Celeris in photorealistic mode. Image/Coastal Engineering Group, USC
You’re a researcher studying the effects of coastal waves on beaches. Or a weather forecaster evaluating how an incoming storm will affect a local beach community. Or a harbor designer building a barrier called a breakwater to protect ships from large waves. In any case, your research begins the same way:
After collecting the necessary data, like geographical measurements and wave characteristics, you use wave modeling software to solve a series of complex equations that predict how the waves will interact with each other and nearshore entities. This can take anywhere from an hour to a day, depending on a number of factors, such as the time length of the simulation and the resolution of the data. You then take these results and run them through post-processing software that allows you to visualize them, a necessary step to put the results into context. A high-quality visualization will require another few hours.
Finally, you can look at the results. But now you need to know what will happen if the storm comes in from another direction, or if the breakwater was moved 10 feet to the left. You make the changes and start the process again, prepared to wait several more hours for the new results.

Faster than real-time simulation with Celeris, showing wave breaking and refraction near the beach. Video/Sasan Tavakkol
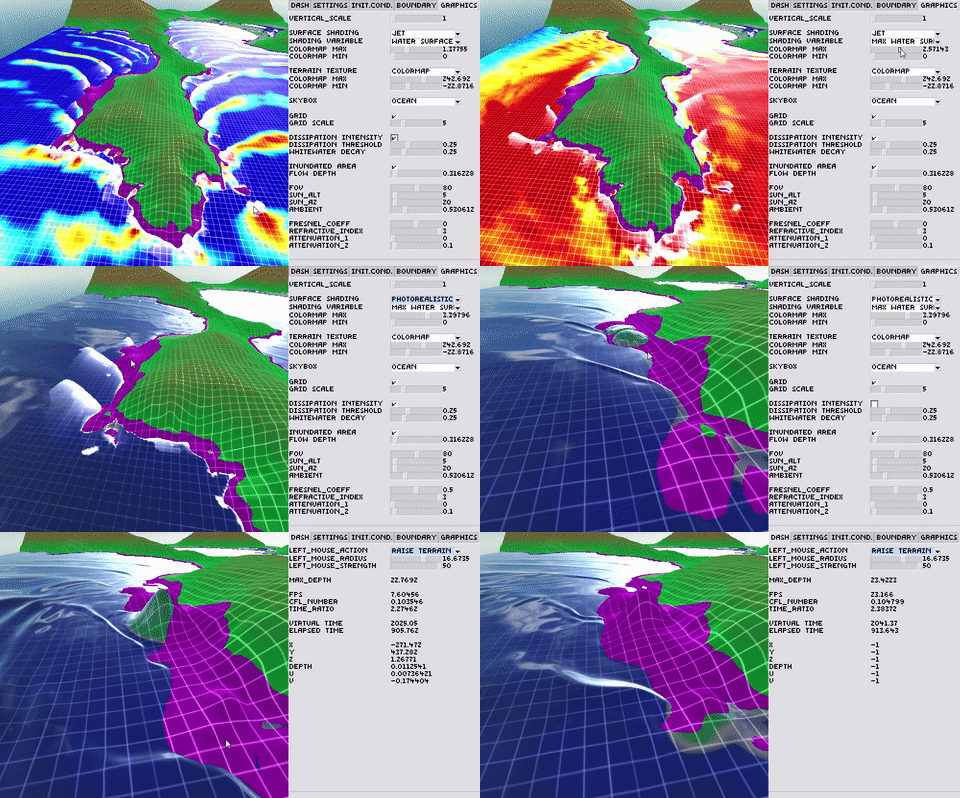
Luckily, researchers at the USC Viterbi School of Engineering have developed a much faster way of studying coastal waves. Their novel, open source software can run these simulations up to hundreds of times faster than currently available models with just as accurate results, all on an average laptop computer. With their software, named Celeris (Latin for “fast”), you can visualize the results and make changes in real-time, as the simulation is running.
Sasan Tavakkol, a PhD candidate in the Sonny Astani Department of Civil and Environmental Engineering who developed the software, explained, “You can simulate the waves and see what’s going on in the harbor or the coast while the model is running. And you can interact with the model like it’s a game.”
Celeris actually has a lot in common with computer games. In order to make the model fast and interactive, the researchers use the computer’s graphic processing unit, also known as GPU or graphics card, in addition to the central processing unit, or CPU. While CPUs typically have a few powerful processors, GPUs are comprised of hundreds to thousands of small processing units that can work together to achieve the performance necessary for the high-resolution animations found in computer games.
GPUs do so by working in parallel, meaning that many calculations or processes are happening at the same time. “That’s the difficult part of solving these equations,” Tavakkol said. “Celeris solves some pretty complicated equations to simulate the ocean waves and solving them in parallel is not easy. It involves some quite advanced math and algorithms.”
In addition to his PhD work under Professor Patrick Lynett, Tavakkol was a research assistant at the Integrated Media System Center, has a master’s degree in computer science, had two internships at Google and will be interning at Niantic Inc., the company behind Pokémon Go, this summer. He was able to use his knowledge of software engineering to bridge the gap between civil engineering and computer science to create the software.
Developed over a three-year period with funding from the Office of Naval Research (ONR) and National Science Foundation (NSF), Celeris was made available to the public in January 2017 and has since been downloaded over 1,000 times by users spanning over 50 countries. The user manual has been translated to Farsi and Spanish by users in Iran and Mexico.
Members of academia, industry and government have put the software to use as a tool for education, research and project planning. At USC, it’s used to create a five-day forecast of wave conditions at Southern California beaches using data from the Coastal Data Information Program (CDIP) and the National Oceanic and Atmospheric Administration (NOAA) tides and currents website.
Twice a day, for nine different coastal areas, their software runs and creates an animation of the waves for the next five days. That’s 90 simulations each day. “The interesting thing is that the whole website is running on a laptop with an external GPU. The whole cost is something like $1,200,” said Tavakkol.
Currently, with funding from ONR, Tavakkol and Lynett are adding virtual reality and augmented reality capabilities to Celeris. Through a virtual reality headset, users will be able to walk along beaches, stand on harbors or even sit in a boat while watching the waves roll in as the sun sets behind the horizon. Not a bad way to spend your day at the lab.
Published on April 25th, 2018
Last updated on April 25th, 2018


